Solvency II reporting season –
What we've learned so far

As firms prepare to publish their first set of annual regulatory returns under the new Solvency II regime, we take a look at the information that firms have recently disclosed as part of their 2016 reports and accounts.
Overall we’ve seen a healthy recovery in reported headline solvency coverage ratios during the second half of 2016, with most firms finishing the year ahead of where they started.
Reported headline solvency coverage ratios
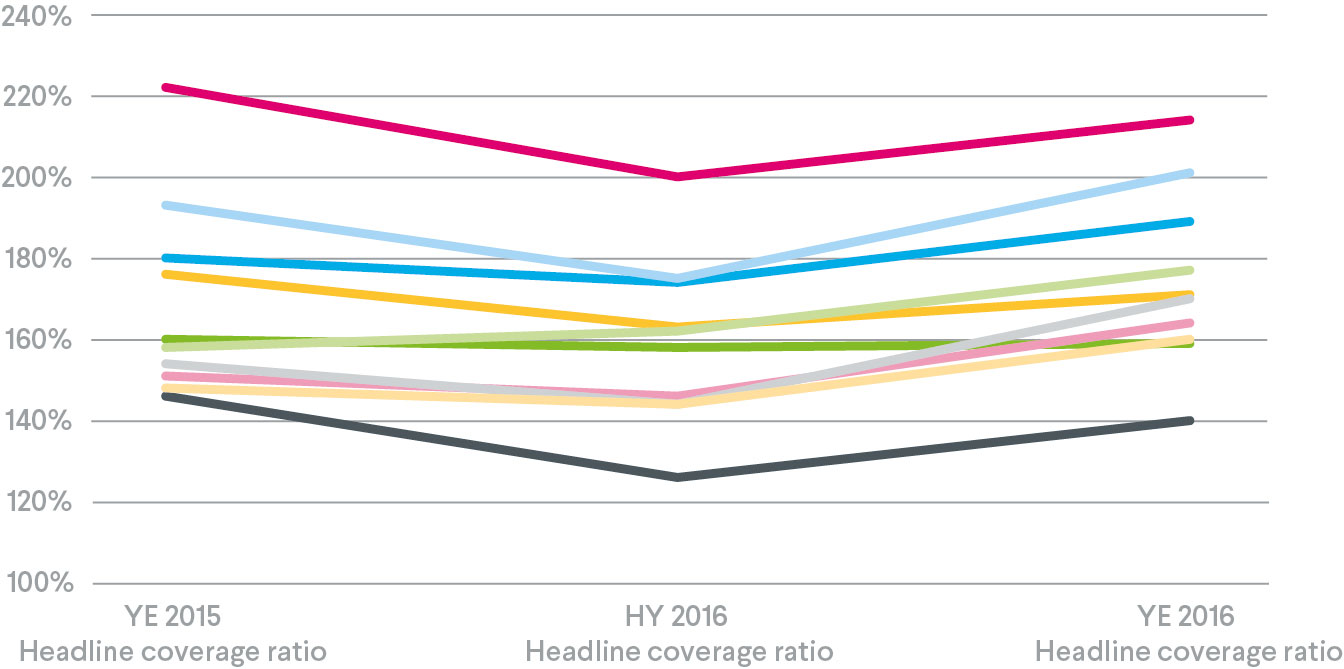
Figure 1 below shows the general trend in reported headline solvency coverage ratios over 2016, based on company reports and accounts. Each coloured line represents a different firm.
These reported ratios are for information only and not intended to reflect or confirm the relative strengths of different firms. One reason for this is that there are some significant differences in how various firms have chosen to calculate and present their headline ratios.
For example, some firms have shown so called “shareholder views” or “investor views”, which adjust the regulatory solvency coverage ratios in respect of items such as surplus in with-profit funds, pension scheme surplus and other forms of restricted surplus.
Between the start and the middle of the year, headline coverage ratios fell almost universally – with a large driver of this reduction being the sharp drop in interest rates witnessed over the period.
By the end of 2016, most firms had seen a strong bounce back in their headline coverage ratios, with the average coverage ratio being c.5 percentage points above the opening Solvency II position. This is reflected by the general “V” shapes in Figure 1 below. This bounce-back was driven by, amongst other things, interest rates rising over the final quarter of 2016 and firms undertaking a number of management actions.
Figure 1 - Headline solvency coverage ratios over 2016

Source: Company reports and accounts for 2016
The ratios shown are generally for the groups, although some firms have based their headline coverage ratios on their main insurance operating entity.
Where firms have changed their reporting methodology during 2016 and restated their previous coverage positions we have used these for consistency.
Note that some of the reported ratios include the effect of a “notional” recalculation of the Transitional Measure on Technical Provisions (TMTP) at 31 December 2016. Others include only the effect of the most recent TMTP recalculation that has been approved by the PRA.
Solvency coverage ratio sensitivities
Additionally, firms have reported a range of sensitivities for their headline solvency coverage ratios. Common sensitivities include shifts in interest rates, drops in equity market levels, changes in credit spreads and strengthening longevity assumptions.
As was the case for the opening Solvency II balance sheet, interest rates are one of the key financial risk exposures for the balance sheet at the end of 2016.
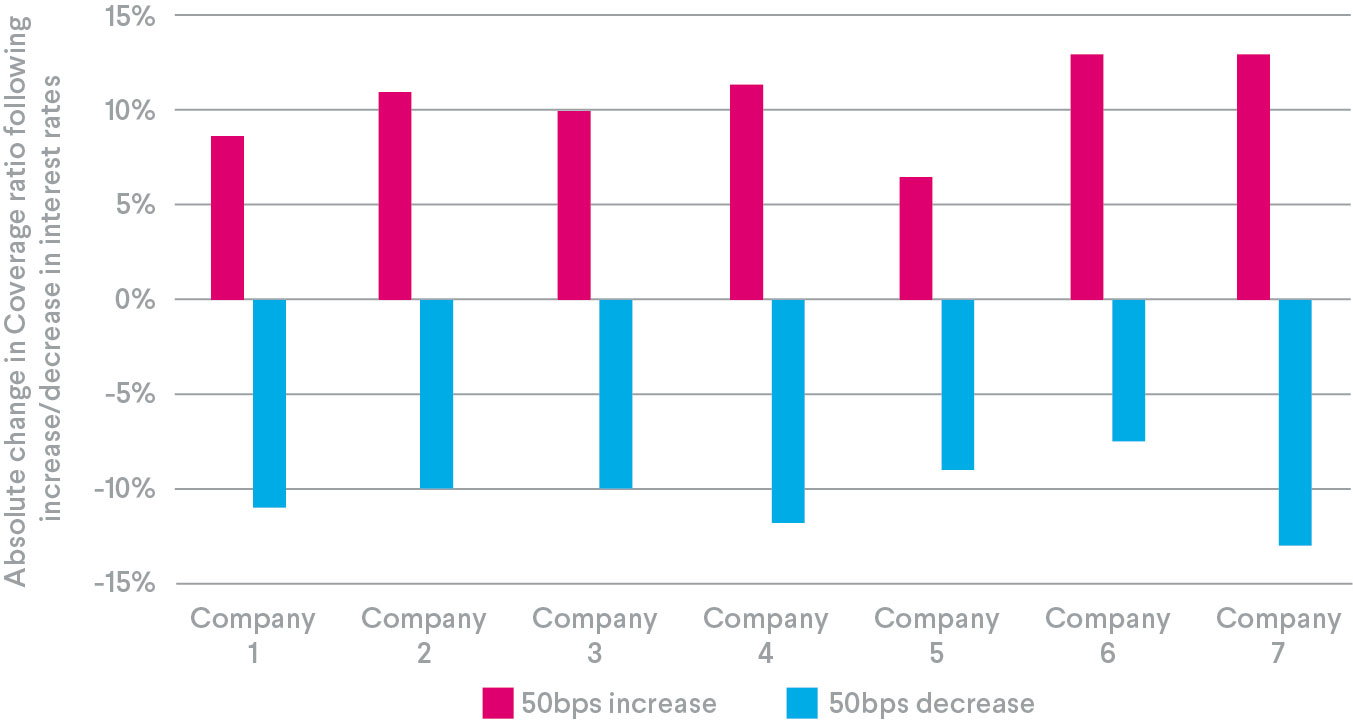
Figure 2 below shows the sensitivity of firms’ headline solvency coverage ratios to a +/- 50bps parallel shift in interest rates. On average, a 50bps drop in interest rates leads to a c.10 percentage point reduction in the solvency coverage ratio.
Note that for many of the firms shown in Figure 2, the sensitivities to interest rate movements assume a recalculation of the Transitional Measure on Technical Provisions (“TMTP”) when interest rates rise or fall by 50bps.
Without the ability to recalculate, these sensitivities would potentially be larger.
Figure 2 – Sensitivity of headline solvency coverage ratios to changes in interest rates

Source: Company reports and accounts for 2016
In the chart above, some of the sensitivities have been scaled to give an estimate of the impact for a +/- 50bps parallel shift in interest rates. This scaling has been done to allow comparison between firms.
Management actions
Recalculation of TMTP is one of the key management actions that firms have implemented out over the course of 2016.
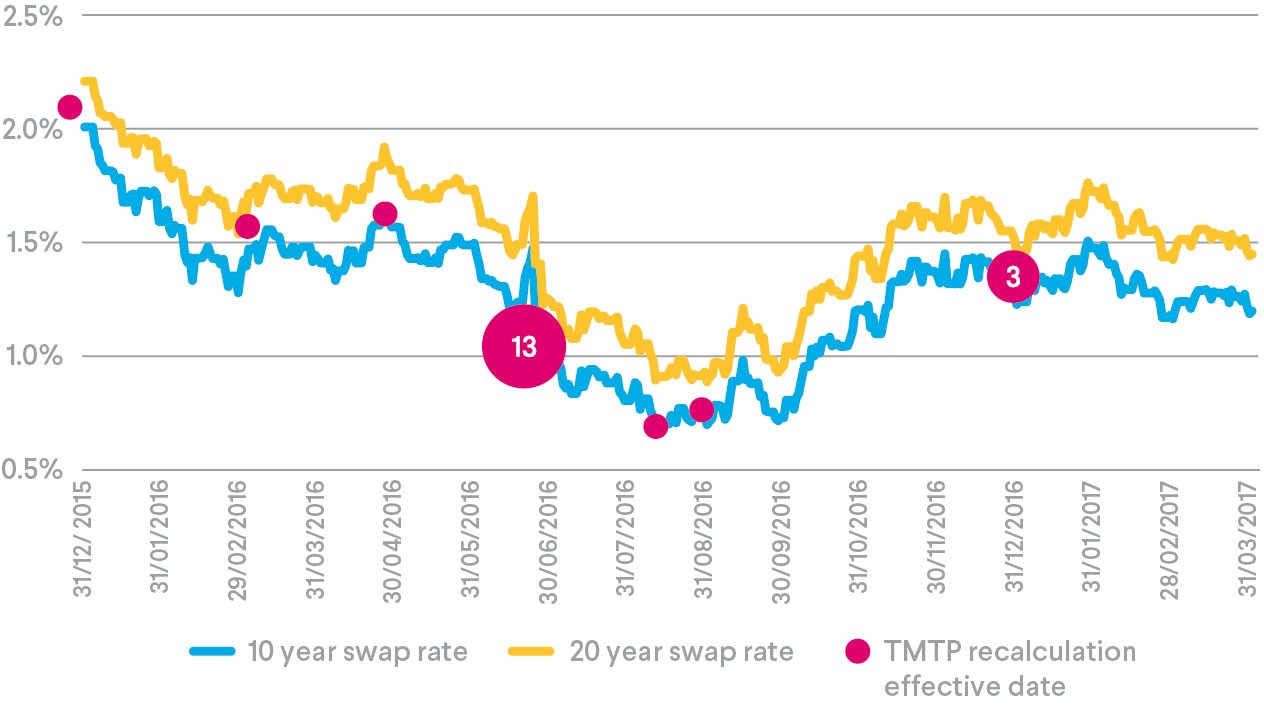
Figure 3 below shows how 10 and 20 year swap rates moved over 2016, and overlaid on top of this are the instances of firms recalculating TMTP. Unsurprisingly we saw a large number of recalculations at the half-year point after rates had fallen by as much as 1% since the beginning of the year – these would have provided a welcome boost to solvency coverage.
There have been three firms recalculating at the end of 2016, although these recalculations were for reasons other than changes in the risk-free rate. Nevertheless, for some firms, the reported year-end 2016 headline solvency coverage ratios (as shown in Figure 1 above) include a notional recalculation of TMTP at that date. Such a recalculation would typically reduce the solvency coverage ratio, largely due to the back-up in interest rates witnessed over the last quarter of 2016.
Figure 3 – Hymans Robertson TMTP recalculation index

Source: Hymans Robertson TMTP recalculation index, FCA register
The figures in the pink circles show how many firms had recalculations effective on these dates.
Aside from TMTP recalculations, we have also seen firms implement a number of other management actions over the course of 2016 in order to strengthen their balance sheets.
These include business transfers; increased levels of reinsurance; asset liability management initiatives; issuance of debt/equity; use of longevity swaps; widening of Matching Adjustment portfolios to include further assets and liabilities.
Where do we go from here?
After a baptism by fire in the first six months of the Solvency II regime, most firms have seen a healthy recovery in their headline solvency coverage ratios and finished the year in a better position than they started it.
But there are still many more opportunities for firms to further strengthen their balance sheets and to put in place safeguards against further volatility in financial markets. The sensitivities disclosed for interest rate movements are a stark reminder of this.
With Brexit on the horizon, it’s crucial for firms to have the necessary frameworks in place which will allow them to navigate safely through the potentially choppy waters ahead. We are currently supporting a number of firms in this area, so please get in touch with one of our experts if you would like to learn more.
Contributing Authors:

Ross Evans Fyona Allan Yaryee Wong Andrew Scott

